Meteoalarm Weather Warnings PHP WebService

Posted January 1, 2018 by waynedgrant
Categories: Code Projects, Meteorology, Open Source, Weather Station

Tags: , , , ,

Accurate, localised weather warnings are a useful addition to any weather website. Historically I have used Wunderground’s Alerts API for this purpose on my own weather website. However, at some point last year Wunderground’s Alerts API stopped returning any weather warnings for the UK even during major weather events. At the time of writing this is still the case.

I noted that Wunderground were receiving their European weather warning data from Meteoalarm. Looking at their website I found that weather warnings from the UK were being reported accurately matching exactly what the UK MetOffice (the source of Meteoalarm’s UK data) were publishing on any given day.

To my disappointment neither Meteoalarm nor the MetOffice published a webservice API for weather warnings. Meteoalarm do, however, provide RSS feeds of weather warnings for each country and region in Europe that they support.

I decided to use Meteoalarm’s RSS feeds to solve my own issue with publishing weather warnings to my website for my local area. However, I knew that directly publishing raw RSS feeds would not be not flexible enough for my needs. I would instead prefer a RESTful JSON formatted web service API which I could call via AJAX.

To this end I’ve written meteo-alarm-weather-warnings. This is a PHP API available on GitHub under the MIT License. It’s primary use case is to make it easy to incorporate the latest MeteoAlarm weather warnings into a web site while not requiring users to directly engage with the underlying RSS feeds. The web service fetches the appropriate RSS feed for a given request and parses and converts it into a consistent JSON formatted reply.

It’s functionality includes:

  1. The ability to query for all weather warnings for all regions within any European country covered by Meteoalarm for today and tomorrow.
  2. The ability to query for weather warnings for any individual region for today and tomorrow.
  3. Custom date/time formats to use for results.
  4. Custom time zone to use for date/times in results (Meteoalarm reports all date/times in CET).

For example, here is a portion of the the raw JSON results from meteo-alarm-weather-warnings for the UK on 31/Dec/2017 when several warnings were in effect:

meteo-alarm-weather-warnings

Click to Enlarge

meteo-alarm-weather-warnings is now incorporated into my own weather web site’s weather warnings page. Here is how it looked rendering results from the web service for my local area on 31/Dec/2017:

meteo-alarm-weather-warnings on website

Click to Enlarge


Equity for Punks BottleBox Club

Posted June 19, 2016 by waynedgrant
Categories: Craft Beer

Tags: , , ,

This year I took the opportunity to invest in BrewDog via Equity for Punks IV. I love what BrewDog are doing in the craft beer arena and am happy to support them. Besides which being a shareholder comes with a few perks such as discounts in BrewDog bars and on their online store.

A further benefit is the opportunity to join the EFP specific BottleBox club. The EPV BottleBox club is a subscription service which delivers a box of 12 BrewDog beers either monthly or bi-monthly.

I deliberated over joining for a couple of weeks primarily because I was not sure exactly what to expect from the club. I was most interested in getting a good selection of different BrewDog beers with some rarer and/or special beers to lay down for a later date.

Finally I just went for it and chose the annual up-front payment which got me one of the monthly boxes for free. So for a £385 investment I would get 12 boxes of beer at £32 each (including postage).

My BottleBox was delivered via ParcelForce. Personally, as someone who works, I am not a fan of ParcelForce as I find their weekday, working hours only delivery service to be too inflexible. However, I had a word with a BrewDog staffer and they told me that Doddle and CollectPlus pick-up delivery options are in the pipeline.

Via ParcelForce I opted for a delivery to my local post office and picked up my first box of beer from there. It was well packaged and arrived undamaged:

20160617_172644

Click to Enlarge

Here’s what I found in the June BottleBox:

  • Monk Hammer – can
  • Jack Hammer – can
  • Dog D – bottle
  • Bourbon Baby – bottle x 2
  • Kingpin – bottle
  • AB:19 – bottle
  • Dead Pony Club – bottle
  • Jet Black Heart – bottle
  • Arcade Nation – bottle
  • Black Hammer – can x 2
20160617_173411

Click to Enlarge

By my reckoning that is £44 worth of beer (I’ve used cheaper supermarket prices for those the beers that are normally available there). Not bad for £32. Plus I get the chance to try many Brew Dog brews I have not sampled before.

Of this selection I have previously tried Jack Hammer (albeit in bottle form), Dead Pony Club, Jet Black Heart and Arcade Nation (a personal favourite of mine).

In addition to those beers I received a bottle of the newly released lager Kingpin, some aged Dog D, a bottle of AB:19 and two bottles of Bourbon Baby (one I have very much enjoyed and the other I have laid down).

To round off the box there were a selection of three Hammer Heads cans. The Black Hammer about blew my mouth off with its 200+ IBUs (which was actually a welcome thing). The remaining Black Hammer and the Monk Hammer will be saved for a rainy day.

As well as the beers you get tasting notes…

20160617_174219

Click to Enlarge

…which give details of all the beers in the box:

20160617_174248

Click to Enlarge

That was my first BottleBox which I am very happy with. I’ll be appending to this post as I get each delivery detailing what is in it so that anyone thinking of subscribing has an idea of what they could get.

July 2016 BottleBox

  • Black Eyed King Imp – can
  • Kingpin – can
  • Paradox Islay – bottle
  • Candy Kaiser – bottle
  • #Mashtag 2016 – bottle x 2
  • Electric India – bottle x 2
  • Elvis Juice – bottle
  • Ace of Chinook – bottle
  • Hop Fiction – bottle
  • Jack Hammer – bottle
20160714_201155

Click to Enlarge

August 2016 BottleBox

  • Electric India – can
  • Albino Squid Assassin – can
  • Ship Wreck – bottle
  • Hardcore IPA – bottle
  • Kingpin – bottle
  • Dead Pony Club – bomber
  • AB:20 – bottle
  • Hello My Name is Ingrid – bottle x 2
  • Barrel-Aged Albino Squid Assassin – bottle
  • Restorative Beverage for Invalids and Convalescents – can x 2
  • BrewDog Crest Bottle Opener
20160811_161802

Click to Enlarge

September 2016 BottleBox

  • Elvis Juice – can
  • Kingpin – can (although it should be Hop Fiction according to the tasting notes)
  • 5am Saint – bottle
  • Ace of Citra – bottle x 2
  • Dog E – bottle
  • Paradox Islay – bottle
  • Jack Hammer – bottle
  • Vagabond Pale Ale – bottle
  • Electric India – bottle
  • Black Hammer – can
  • Black Eyed King Imp – can
20160915_174215

Click to Enlarge

October 2016 BottleBox

  • Neon Overlord – can x 2
  • Chilli Hammer – can x 2
  • Pumpkin Kin – bottle
  • AB:21 – bottle
  • Paradox Islay – bottle
  • Candy Kaiser – bottle
  • Jet Black Heart – bottle
  • Punk IPA – big can
  • Kingpin – can
  • Restorative Beverage for Invalids and Convalescents – can
20161013_162001

Click to Enlarge

November 2016 BottleBox

  • Electric India – can
  • 5am Saint – bottle
  • Zeitgeist – bottle
  • Hello My Name is Ingrid – bottle x 2
  • AB:20 – bottle
  • Beatnik Brewing Collective, Imperial Read Ale – bottle x 2
  • Hardcore IPA – bottle
  • Dog E – bottle
  • Elvis Juice – bottle
  • Black Eyed King Imp – can
  • BottleBox Beer Club Patch
20161110_173709

Click to Enlarge

December 2016 BottleBox

20161217_112212

Click to Enlarge

  • Jack Hammer – bottle
  • Cocoa Psycho – bottle
  • Hoppy Christmas – bottle x 2
  • Casino Rye Ale – bottle
  • Tokyo* – bottle
  • Santa Paws – bottle x 2
  • Ace of Equinox – bottle x 2
  • Jet Black Heart – bottle
  • Flat-Pack Fruit Bat – can
20161217_112621

Click to Enlarge

January 2017 BottleBox

  • Rye Hammer – can x 2
  • Tokyo* – bottle
  • Elvis Juice – bottle
  • Candy Kaiser – bottle
  • Vagabond – bottle
  • Hardcore IPA – bottle
  • Punk IPA – bottle
  • AB:21 – bottle
  • Jack Hammer – can
  • Self Assembly Pope – can x 2
20170113_172358

Click to Enlarge

  • Hop Shot – 110ml bottle
20170117_165953

Click to Enlarge

February 2017 BottleBox

  • Hop Shot – 110ml bottle x 2
  • Cocoa Psycho – bottle
  • Hardcore IPA – bottle
  • Elvis Juice – bottle
  • Zeitgeist – bomber x 2
  • Punk IPA – bomber
  • Jet Black Heart – bottle
  • Rye Hammer – can
  • Jack Hammer – can x 2
  • BottleBox Bar Blade
20170217_183325

Click to Enlarge

March 2017 BottleBox

  • Kingpin – can
  • Hop Fiction – can x 2
  • Punk IPA – bottle
  • Jack Hamer – bottle
  • Coffee and Cigarettes – bottle x 2
  • Dead Pony Club – bottle
  • 5AM Saint – bottle
  • Semi-Skimmed Occultist – can x 2
  • Zeitgeist – can
20170320_180733

Click to Enlarge

April 2017 BottleBox

  • Born to Die 13.05.2017 – can
  • Punk IPA – can
  • Jack Hammer – can
  • Elvis Juice – can
  • Paradox Rye – can
  • The Physics – bottle
  • Punk IPA – bottle
  • Hop Rocker – bottle
  • Dog F – bottle
  • Jet Black Heart – bottle
  • 5AM Saint – bottle
  • Kingpin – bottle
20170413_151139

Click to Enlarge

May 2017 BottleBox

  • Hop Fiction – can x 2
  • Jack Hammer – can
  • Dead Pony Club – bottle
  • Elvis Juice – bottle
  • Zeitgeist – bomber
  • Hardcore IPA – bottle
  • Cocoa Psycho – bottle
  • Paradox Rye – can
  • Punk IPA – can
  • Kingpin – can
  • Semi-Skimmed Occultist – can
  • Schooner Glass


20170510_180029

Click to Enlarge

FIN


Personal Kanban Board Examples

Posted March 26, 2016 by waynedgrant
Categories: Agile

Tags:

I am a big proponent of using Personal Kanban for personal work management. It is an effective technique that allows people to visualise their tasks and limit their work in progress. I’ve used Personal Kanban for the last three years in both my professional and personal life. While I have used various online solutions to create my Personal Kanban boards I prefer to use a real physical board. The visibility and tactile interactions of a real board cannot be beat by even the my most convenient app, mobile or otherwise.

Over this time I’ve snapped a few pictures of the various boards I have put together which I present here.

Below is one of my first Personal Kanban boards from three years ago. My wife and I were relocating from Scotland to the US and had a lot to do to make the move happen smoothly. We were figuring out how to manage the large amount of work we had to do when she asked “can’t we just use one of those board things you use at your work”. By “board thing” she meant “task board”.

I had a small 1.5 x 1 foot whiteboard in my home office at the time. On this I created the TODO, DOING and DONE swim lanes using electrical tape. This board was way smaller than those I typically used for task boards in work but by using small (5 x 3 cm) stickies we were able to fit all of our tasks on. Such tiny stickies are what I have used for my Personal Kanban boards ever since. They minimise my boards’ footprint and force me to be concise with my task naming, especially if I write using a sharpie.

The board worked out well. Its visual nature helped us to build a backlog, prioritise tasks easily and see where we were in the overall move process.

mini whiteboard - moving house

Click to Enlarge

I then started using a Personal Kanban board actively in the work place. At the time this picture was taken I was in a cube in the US with nowhere to put even a small whiteboard. Undeterred I crafted the equivalent to a board on my desktop using painters tape for the swim lanes. Note the addition of the BLOCKED column which I find invaluable.

desktop - taped lanes

Click to Enlarge

More recently, back in Scotland, I had reduced desk space so I created as minimalist a desktop Personal Kanban as I could. The swim lane labels are simply sellotaped to the desk with the tasks arrayed in line below.

deskop minimalist

Click to Enlarge

Similarly when on business trips one of the first things I do at my temporary desk is create a quick ad-hoc Personal Kanban board. All that’s required are mini stickies and a sharpie pen.

on the road

Click to Enlarge

Lately my employer has introduced a strict clear desk policy. It looked like my Personal Kanban board would have to go as leaving any written materials on my desk overnight, no matter how innocuous or terse, would break the rules .

Instead I created a more mobile board that I could lock away in a drawer. The basis was a small cardboard box my new webcam had arrived in. I flattened it out, used a sharpie to draw on swim lanes and attached stickies with swim lane labels using sellotape. Finally I used blu tack on the underside of the board to keep it in place on my desktop during the day.

This solution works well and is my current Personal Kanban board. The bonus is that it folds up easily along the original cardboard folds. This allows me to slot it into a small envelope and take it with me when I work at home or go on business trips.

portable

Click to Enlarge

The last example board is not a Personal Kanban board but is the smallest board I have ever created. A colleague and I were the only two developers working on a web app to an aggressive timescale. We wanted a task board to visualise the work but both had an aversion to using JIRA as an online board. Fortunately we sat next to each other separated only by a waist high partition. However, local policy forbade any whiteboards in our workspace as they were seen as being untidy. In addition, due to the partition there was nowhere to put a desktop task board where we could both see and interact with easily.

I then had the idea of making use of the narrow top surface of the partition itself. It worked rather well:

tiny task board

Click to Enlarge


Pebble Watch Screen Tearing Fix (with lots of pictures!)

Posted February 1, 2016 by waynedgrant
Categories: Pebble

Tags:

I’m a big fan of the original Pebble Watch. Day-to-day it allows me to keep my phone in my pocket while still getting my notifications and controlling my music and its long battery life at around a week negates the fact it doesn’t have fancy graphics. I’ve even coded an app or two for it.

The only annoying thing about the Pebble is the infamous screen tearing issue. I’m on my third Pebble in three years and every single one has succumbed to this intermittent issue within a year:

CL-h7ILWwAAxPfJ

Click to Enlarge

Credit to Pebble – they’ve carried out two free replacements for me so far with no arguments. One of those was out of warranty. They didn’t even want the broken one back the second time around. So now I’ve got two Pebbles with the annoying screen tearing issue.

I was sure Pebble would do a fourth replacement if I asked nicely. However, this seemed very wasteful for what could be a simple issue to fix myself. Indeed I’d seen a few forum threads like this one describing how I could go about making a fix myself. Based on these I set about fixing both my Pebbles with only a few tools. Each Pebble took less than three minutes to fix. With a little care you can do the same.

This is my step-by-step guide to fixing the screen tear issue. I’ve included what I didn’t see in any of the guides I read – lots of pictures covering each step.

1) There’s some stuff you’ll need as pictured. Left to tight we have a small flat head screwdriver (I use an electrical screwdriver), a small Torx screwdriver (I used a size T4), an edged plastic tool, some masking/painters tape and some scissors.

The only stuff I had to buy was the Torx screwdriver and the plastic tool. I ordered a really cheap mobile phone repair kit from Amazon (only £3) to get these.

20160201_185207

Click to Enlarge

2) You’ll also need a broken Pebble. Flip it over and you’ll find four small screws, one in each corner. I believe the original KickStarter Pebbles have no screws and are therefore probably glued together so I’m afraid you are on your own if you’re one of the early adopters.

20160201_185317

Click to Enlarge

3) Use the Torx screwdriver to remove all four screws.

20160201_185524

Click to Enlarge

4) Put them somewhere safe as they are tiny and look really easy to lose.

20160201_190210

Click to Enlarge

5) Next is the tricky bit. Take the plastic tool and prise the back cover off. Be very careful here as you don’t want the back cover to come completely off yet (and if it does your Pebble will be completely broken as a result. You’ll see why in the next step). Just break the seal all the way round and lift the back case no more than a few millimetres.

20160201_190439

Click to Enlarge

6) Slowly prise the back cover away from the top and take a look inside your Pebble. Looking at it from the top you’ll find a small, round vibrator on the lower left-hand corner. This is glued to the inside of the back cover and attached by two tiny wires to the main body of the watch. It looks really easy to snap these wires if you pull the back cover away from the watch too far.

20160201_190643

Click to Enlarge

7) Instead use the small flat head screw driver to prise the vibrator off the back case.

20160201_190604

Click to Enlarge

8) Now completely remove the back case. The vibrator will remain connected to the Pebble by its wires when you do this.

20160201_190757

Click to Enlarge

9) Push the vibrator back down into the case. Then take a length of masking tape and fold it over on itself four of five times. Cut the folded tape to be the same width and height as the bottom compartment of the Pebble not including the tall gold section on the left side.

20160201_191124

Click to Enlarge

10) Place the masking tape into position as pictured.

20160201_191148

Click to Enlarge

11) Finally reattach the back case and replace the four tiny screws using the Torx screwdriver.

You should now have a jagged screen free Pebble. It probably isn’t water proof anymore but at least you can read the display.


Met Office Weather Maps PHP API

Posted October 17, 2015 by waynedgrant
Categories: Code Projects, Meteorology, Open Source, Weather Station

Tags: , , , ,

For those who want to add detailed weather maps of the UK to their websites an excellent option is to use the Met Office’s DataPoint web service API. Among many other features the API makes available several different types of observation and forecast time series weather maps as detailed images.

However, DataPoint still leaves users with a lot of work to do if they want to utilise the maps on their websites. For example the DataPoint API only provides the map images as simple layers with no underlying map of the UK. This gives users the flexibility of adding their own UK maps but creates one of many common problems that all DataPoint users have to solve individually.

To address this and other website integration issues I’ve made the met-office-weather-maps PHP API available on GitHub under the MIT License. It’s primary use case is to make it easier to incorporate the latest Met Office weather maps into a web site while not requiring users to directly engage with the Datapoint API.

It’s functionality includes:

  1. Wrapping the complexity of underlying JSON web service calls by exposing one simple PHP class for each available map type.
  2. Adding tailored UK map layers to fetched images that obey the required Mercator projection boundary box.
  3. Adding UK timestamps to map images where they are not already present.
  4. Operating caching to allow maps to be requested on a regular schedule. This ensures that the latest maps are fetched without making excessive calls to DataPoint which may breach their fair use agreement.

The met-office-weather-maps API supports all of the DataPoint map types:

  • Infrared satellite
  • Lightning strikes
  • Precipitation forecast
  • Pressure forecast
  • Rainfall radar
  • Surface pressure charts
  • Temperature forecast
  • Total cloud cover forecast
  • Total cloud cover and precipitation forecast
  • Visible satellite

See the met-office-weather-maps Git Hub project page for details of its requirements, installation and API documentation.

I originally wrote met-office-weather-maps for incorporation into my own weather website where I regularly fetch a selection of weather maps. I previously used Weather Underground’s map API but I find DataPoint to be far superior in terms of map selection and the high frequency of map update.

See below for some real examples that demonstrate met-office-weather-map’s capabilities.

Example 1: Surface Pressure Forecast Map

The Surface Pressure Forecast image available from DataPoint is a transparent layer depicting isobars and fronts:

Click to Enlarge

The same image after processing by met-office-weather-maps. Note the addition of a timestamp and a colour base image of the UK:

Click to Enlarge

Example 2: Visible Satellite Map

The Visible Satellite image available from DataPoint is an opaque layer depicting cloud cover:

Click to Enlarge

The same image after processing by met-office-weather-maps. Note the addition of a yellow outline overlay image of the UK which does not obscure the existing image layer’s timestamp and key:

Click to Enlarge

Example 3: Temperature Forecast Map

The Temperature Forecast image available from DataPoint is a partially transparent layer depicting colour-coded screen temperature:

Click to Enlarge

The same image after processing by met-office-weather-maps. Note the addition of a timestamp, a colour base image and a black outline overlay image of the UK:

Click to Enlarge

Example 4: Cloud Cover and Precipitation Forecast Map

The Cloud Cover and Precipitation Forecast image available from DataPoint is a transparent layer depicting cloud cover and colour-coded precipitation rates:

Click to Enlarge

The same image after processing by met-office-weather-maps. Note the addition of a timestamp, a colour base image and a black outline overlay image of the UK:

Click to Enlarge

Road Trip of the Living Dead

Posted May 24, 2015 by waynedgrant
Categories: Expat

Tags: , , ,

I make no secret of my obsession with zombie movies. This does not mean I like just any movie with zombies in it. There’s no place for “Zombies vs Werewolf Strippers” or whatever else in my movie collection. I mean the good zombie movies with subtext, engaging characters and plot. If I had to narrow it down to my top two zombie movies of all time it would by George A, Romero’s  Dawn of the Dead (1978) and Night of the Living Dead (1968) in that order (in my opinion “Dawn” is one of the rare examples of the superior movie sequel).

Both movies were filmed in and around Pittsburgh, Pennsylvania which is around 400 miles from where I’m currently living in New Jersey. I’ve done a number of road trips across the North Eastern US and with time running out on my stay in the USA I embarked on my final vacation here: A Road Trip of the Living Dead.

While the drive to Pittsburgh was a long one for me all of the locations for both movies are within 40 miles of each other. With a car you can easily hit them in a few hours. The google map below shows all the locations and points of interest I took in over a single day.

“Dawn” Locations

For my trip my initial stops were in Monroeville to visit a few “Dawn” locations. These correspond to the red pins on the map.

First up was the so-called “Mall of the Dead”, Monroeville Mall. This is where most of “Dawn” was set.

Click to Enlarge

Click to Enlarge

On the exterior much of the mall is still recognisable especially at the rear.

Click to Enlarge

Click to Enlarge

As it has been almost 40 years since “Dawn” was filmed nothing of the original look remains in the interior. However, you can still locate areas where some of the movie’s action took place such as the corridor leading to the heroes’ hideout.

Click to Enlarge

Click to Enlarge

Up until the week before I visited in May 2015 the small arched bridge featured in the movie still remained. This had just been torn down at the time of my visit which was a disappointment. At the time of writing a campaign was underway to save the dismantled bridge and preserve it in a museum.

Click to Enlarge

Click to Enlarge

Other locations in the mall are more difficult to locate such as the balcony where the notable “No More Room in Hell” dialogue takes place. See the link to “Adam the Woo’s” video at the end of this post for a great guide to how to find this and other locations in the mall.

Next up was the location of the “Zombie Hunt” scenes which is only a couple of miles from the mall on Logans Ferry Road. Unlike the mall this road is mostly unchanged from the movie only missing the army trucks, mob of armed rednecks and National Guardsmen drinking Iron City beer.

Click to Enlarge

Click to Enlarge

A short walk further along Logans Ferry Road is Monroeville Airport where the helicopter refuelling scene and a few zombie kills were filmed. I didn’t attempt to enter the airport as I had no wish to get in trouble with Homeland Security.

Click to Enlarge

Click to Enlarge

Living Dead Museum

Next stop was Evans City which is 40 miles to the North of Monroeville. “Night” and another Romero movie The Crazies (1973) were filmed here.

My first visit in Evans City was to The Living Dead Museum which is the green pin on the map.

Click to Enlarge

Click to Enlarge

The museum is small but packs a load of cool stuff into the space including original props from many of Romero’s movies, memorabilia, a “Maul of Fame” and many recreations of zombies from the films. At $3 it is a bargain. Note that the museum is not open every weekday so check their opening hours on their website if you are planning a visit.

Click to Enlarge

Click to Enlarge

“Night” Locations

Next up were various “Night” locations in and around Evans City which are the blue pins on the map.

I thought Monroeville Mall would be the highlight of my trip. I was wrong as Evans City Cemetery knocks it into a cocked hat.

It looks almost exactly as it did in the opening scenes of “Night” right down to the sign at the entrance.

Click to Enlarge

Click to Enlarge

The particular headstone Barbara cowered behind and the grave stone on which Johnny had his head smashed in remain in place.

Click to Enlarge

Click to Enlarge

I wrapped my trip to Evans City by visiting the Bridge where the posse scenes from “Night” were filmed and the location of the Farmhouse where most of the movie was set. Both are located close together a few miles north of Evans City on Ash Stop Road. The bridge looks quite different as its missing the trusses’ it sports in the film. The farmhouse is long gone having been demolished straight after filming. You can see a newer house sitting on the same foundations from Ash Stop Road.

My final act of the day was to pay homage to the “Zombie Hunt” scene by sampling a few bottles of Iron City beer. A perfect end to a perfect day.

Me with an Iron City

Click to Enlarge

If you want to do a similar road trip then the following YouTube videos by Adam The Woo make for a good overall guide.

The first video takes in most of the locations from “Dawn”. I get the impression that they didn’t have permission for some of their filming which means they visited a few places I wasn’t prepared to trespass in (like the grounds of Monroeville Airport and the back stairwell of Monroeville Mall). The second video recreates all of the action of the “Night” cemetery scene right down to the individual headstones.

“F Weather” Pebble Watch Face

Posted March 21, 2015 by waynedgrant
Categories: Code Projects, Meteorology, Open Source, Pebble

Tags: , , ,

Hot on the heels of my Cirrus Pebble WatchApp I’ve just completed another creation for the Pebble: “F Weather”. F Weather is my homage to one of my favourite web sites: THE FUCKING WEATHER. THE FUCKING WEATHER tells the weather like it is and so does F Weather except it does so for your current location:

Click to Enlarge

Click to Enlarge

There are a few differences between F Weather and my Cirrus WatchApp. First of all this is a watch face rather than a watch app so it’s not interactive (but then again it doesn’t need to be interactive to relate the current temperature through the medium of swearing). Secondly F Weather is written in C and PebbleKit JS. This makes it much faster than the PebbleJS based Cirrus WatchApp. I haven’t written any C for 13 years or so and thoroughly enjoyed getting back into it.

Current conditions are looked up from Yahoo’s RESTful query services which involves two calls.

The first call takes the current longitude/latitude position available to the Pebble and looks up the corresponding WOEID and city name:

https://query.yahooapis.com/v1/public/yql?q=select city, woeid from geo.placefinder where text=”40.87,-74.16″ and gflags=”R”&format=json

The second call uses the WOEID to look up the current temperature:

https://query.yahooapis.com/v1/public/yql?q=select item.condition.temp from weather.forecast where woeid=12760611 and u=”c”&format=json

This process is repeated every 15 minutes.

My code is open source and hosted on github. It can be found here: pebblec-watchface-fweather. The install PBW can be found under Releases.

Cirrus Pebble WatchApp for Weather Display Live

Posted January 17, 2015 by waynedgrant
Categories: Code Projects, Meteorology, Open Source, Pebble, Weather Station

Tags: , , , , ,

I don’t mind admitting that I am a bit obsessed about the weather. I am especially fastidious in keeping up with the current conditions where I live. This has manifested itself in several of my recent coding projects that display data from my weather station including my own web site, a web service, a PiFaceCAD based console and an android app widget.

I bought a Pebble smart watch last year on a whim and have found it useful for its notifications of texts, emails and phone calls (I keep my phone on silent so the Pebble’s vibration based notifications are especially handy). Given I have access to my weather station’s data on all of my other devices doing the same with the Pebble was a logical choice for a new project.

Previous weather projects I have written have directly fetched and processed Weather Display Live’s clientraw.txt file. For my Pebble watch application I wanted to make more use of my own web service. This would simplify the coding process as the service, unlike clientraw.txt, exposes weather data in a well-defined structure and many different measurement units. In addition PebbleJS toolkit has built-in support for making http calls to JSON-based web services.

I coded the application in Javascript using the CloudPebble website. For a browser based IDE CloudPebble is very feature rich with syntax highlighting, github integration and logging. It also has the ability to deploy directly to a pebble watch provided you have a paired smart phone for the watch on the same wireless network as the computer running CloudPebble.

The only other code that was required was a web page to expose configuration settings for the application. This currently has to be hosted on the web. In my application’s case this page allows the configuration of the web service URL and a choice of metric or imperial weather measurement units.

The finished application makes use of the Pebble’s menu UI. It populates a top-level menu of current weather data including temperature, surface pressure, humidity, rainfall and wind. Selecting any of these top-level menu items displays a sub-menu of more in-depth information for the particular measurement including daily high and low values.

As usual my code is open source and hosted on github. It can be found here: pebblejs-watchapp-cirrus.

Click to Enlarge

Click to Enlarge

Cirrus Android Widget for Weather Display Live

Posted December 13, 2014 by waynedgrant
Categories: Code Projects, Java, Meteorology, Open Source, Weather Station

Tags: , , , , ,

One of my recent projects was to develop an Android widget to display the values found in online WD Live clientraw.txt files. It accesses the same data as my other weather related code projects this year: a JSON Web Service for Weather Display Live and a PiFaceCAD Weather Display Console.

I’ve name the Widget “Cirrus” after the cloud genus. The widget supports 18 different weather data points (and displays the current trend for many of these) and 16 different measurement units. It also has colour coding for easy recognition of different temperature ranges (using the BBC Weather temperature colours) and UV index (using the US EPA UV Index colours).

Click to Enlarge

Click to Enlarge

I use the widget to display the current conditions for both my own weather station and others when I travel. So far I have installed and run it successfully on a Samsung Note II (Android 4.4.2), Samsung Galaxy Express (Android 4.1.2) and a 2013 Nexus 7 (Android 5.0.1).

At this time I do not have any plans to publish the widget on the Google Play Store. I have, however, open sourced the code using the MIT License and made it available via GitHub here:

https://github.com/waynedgrant/android-appwidget-cirrus

See the read me for installation and use instructions.


Weather Station Winter Report

Posted November 21, 2014 by waynedgrant
Categories: Meteorology, Weather Station

Tags: , , ,

The onset of Meteorological Winter is a little over a week away here in New Jersey (it runs from 1st Dec to 1st March). Last year’s winter here represented a period of prolonged cold and quite sizeable snow fall. It was certainly more severe than anything my weather station setup experienced in the preceding years in Scotland (although note that the station was only installed there in August 2011 after the severe winters of 2009 – 2010 and 2010 – 2011).

This post relates my experiences with my weather station from last year’s winter (2013 – 2014) and is a record of what worked well and what did not work so well. I run a standard Oregon Scientific WMR200 setup and will describe how well each of the sensors stood up to the harsher than normal conditions. I have illustrated the post with pictures taken at the time and supplemented with various charts produced using my Meteo Sheeva setup.

Winter 2013 – 2014 in New Jersey

Last winter New Jersey, like many parts of the USA, was in the grip of a prolonged Polar Vortex. There were certainly colder places in the USA that winter. There were also places that got a lot more snow. Indeed, according to meteorological records, New Jersey has itself had much colder and more snowbound winters in its past. What made it unusual was how prolonged the cold was and, as a result, just how long the deep snow was able to persist.

Click to Enlarge

Click to Enlarge

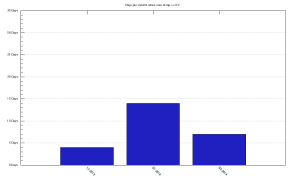
As I have already mentioned it was very cold. The coldest it got according to my instruments was -15.7°C on the morning of 7th January 2014. What was really extreme was that the temperature could remain entirely below freezing for days at a time. The chart below shows the number days per month from December 2013 to February 2014 when the temperature did not rise above 0°C. January was especially gruelling with 14 of 31 days spent entirely below zero.

Click to Enlarge

Click to Enlarge

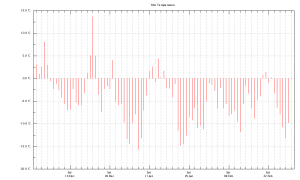
The following chart shows the minimum temperature for every day from the start of December 2013 through to the end of February 2014. Extended cold like this quickly becomes wearing on people and machines alike.

dec - feb min temperature

Click to Enlarge

Note the spike in minimum temperature on 22nd December 2013 (to 13.7°C). This is not a sensor anomaly and I remember that day well. Preceded by some rather cold days the temperature got up to 20.6°C. This made for shorts and t-shirt weather for one day in December. As we can see from the chart the warm weather did not last long and temperatures plummeted and stayed cold thereafter.

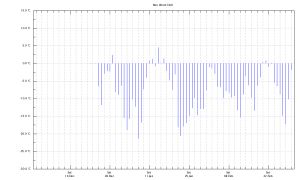
Then there was the wind chill. This dropped to a low of -21.3°C on the same morning as the lowest temperature was recorded. I suspect that the wind chill was worse than this in reality as my anemometer is not in the most exposed of locations. The graph below shows the daily minimum wind chill from late December 2013 (when the sensor was installed) through to the end of February 2014.

Click to Enlarge

Click to Enlarge

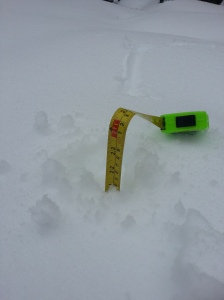
Finally there was the snow. Up to 2 feet was present on the ground for weeks at a time. The problem was not that it snowed an incredible amount. Instead what did fall remained for weeks at a time because of the consistently low temperatures.

snow depth

Click to Enlarge

Weather Station Sensor Location

The siting of my weather station’s sensors has some bearing on my experiences last winter so I will describe that briefly here.

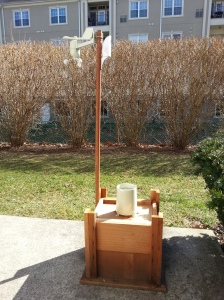
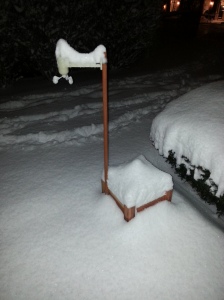
I am not entirely happy with my weather station setup at the moment. Unlike my previous setup in Scotland I am constrained in terms of space having no garden or roof to speak of. The anemometer/wind vane and rain gauge are installed fairly low down on the makeshift box and pole arrangement pictured below (a UV sensor is also pictured but this was not actually installed until mid-2014). The Temperature/Humidity sensor is better situated and can be found round the corner on another pole in a spot well sheltered from the sun.

Click to Enlarge

Click to Enlarge

Batteries

Before I turn to each sensor’s winter performance I will talk a little about batteries. Oregon’s various sensors are wireless and are therefore powered by AA or AAA batteries. Conventional wisdom in weather station circles goes that it is best to swap from alkaline over to lithium batteries when it gets cold as they perform better in such conditions. I stuck it out with normal alkaline batteries last winter and suffered no signal drop-outs from my sensors. Lithium based batteries are no doubt better for extremely cold conditions but they are an unnecessary expense for the kinds of conditions I saw last winter.

Temperature/Humidity Sensor

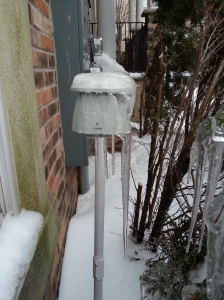
The WMR200 comes complete with a THGN801 temperature and humidity sensor. The sensor is a relatively small box installed within a plastic weather shield. Mine is mounted on a pole about a metre off the ground. During the winter the shield did its job well as it became heavily encrusted with ice and protected the sensor which kept reporting consistently with no signal drop-outs throughout the winter. The shield even sported a 30cm icicle at times as pictured below.

Click to Enlarge

Click to Enlarge

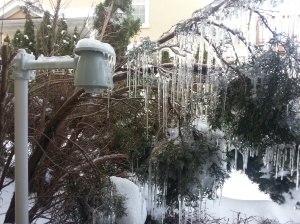
Ice was a real hazard generally last winter. Indeed the accumulated ice managed to bow the previously vertical trees near the sensor to be almost horizontal under its weight.

winter weather

Click to Enlarge

The only let down with the THGN801 was a strange behavior that manifested whenever the air temperature dropped to -10°C. Whenever this occurred the humidity would continue to be reported by the sensor but would not vary until the temperature rose above -10°C at which point it would start to report the true value again.The following chart shows this behavior starting at just after midnight on the 7th of January and persisting until mid-morning on the 8th of January (where the blue plot goes flat).
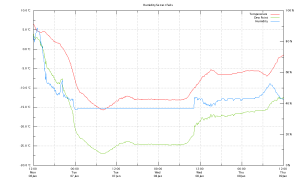
Click to Enlarge

Click to Enlarge

Basically the humidity reported by the THGN801 below -10°C will almost certainly be incorrect and as will the associated dew point. Various weather forum searches have informed me (for example, here) that this is not an individual sensor fault but an endemic problem with the THGN801 and other similar sensors . If I lived in an area with frequent -10°C cold I would not be relying on Oregon gear.

Anemometer / Wind Vane

The WGR800 is a combined anemometer and wind vane. Mine is mounted, less than ideally, on a relatively short pole. The sensor performed well with no signal drop-outs all winter. The only issue I had with it was with the wind vane component on top and I put this at least partly down to its low position. When heavy snow fell on it overnight it could become encrusted on the vane which froze and locked into a single fixed position. Pictured below is one occurrence of this (note the rain sensor is starting to disappear beneath the snow. More on this below).

Click to Enlarge

Click to Enlarge

While frozen the wind vane reported a constant (and incorrect) wind direction until it defrosted sufficiently to move again. This wind vane would typically only be frozen for a few overnight hours at a time when there was heavy snowfall. One such instance is charted below when there was wind but a suspiciously constant South-Easterly wind.
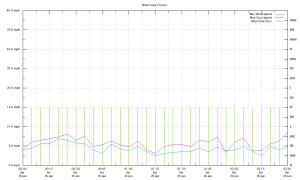
wind vane frozen 25 jan

Click to Enlarge

Rain Gauge

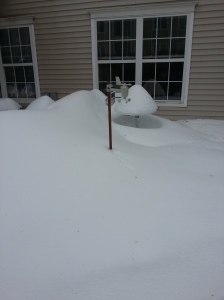
The final outdoor sensor I had last winter was the PCR800 rain gauge. There is not much to say here as it was completely buried under deep snow for much of last winter as pictured below. Once it was buried I felt it was safer (for it and for me) to leave it there insulated under the snow until it was revealed in the thaw. Despite its imprisonment it reported (understandably zero rainfall) constantly with no signal drop-outs throughout the winter.

Click to Enlarge

Click to Enlarge

Winter 2014 – 2015 in New Jersey

My setup remains the same as it did last winter apart from the addition of a UVN800 UV sensor. Customer reviews show this to be a particularly delicate sensor prone to permanent failure in colder conditions. Given that temperatures here are already falling frequently below zero and UV is already a distant summer memory I have already mothballed the sensor until spring comes around.

The rain sensor did fail the following May when it was hit by 11.5 cm/hr rain. As a result its innards got a bit wet and no amount of drying could get it to signal consistently again thereafter. I have since replaced it with a spare unit. The question is, did its icy incarceration shorten its time span? I will never know but if my replacement rain gauge starts to become entombed in the same way this winter I will fish it out and bring it inside. There is no point in risking it in conditions where there is no rain to report anyway.

With a week to go and temperatures already plummeting here I have prepared all of the deployed sensors with new batteries. All that remains now is to see what this winter will bring to my corner of New Jersey.